A Global Roadmap for Autogas
Doubling market share: the Alternative Scenario
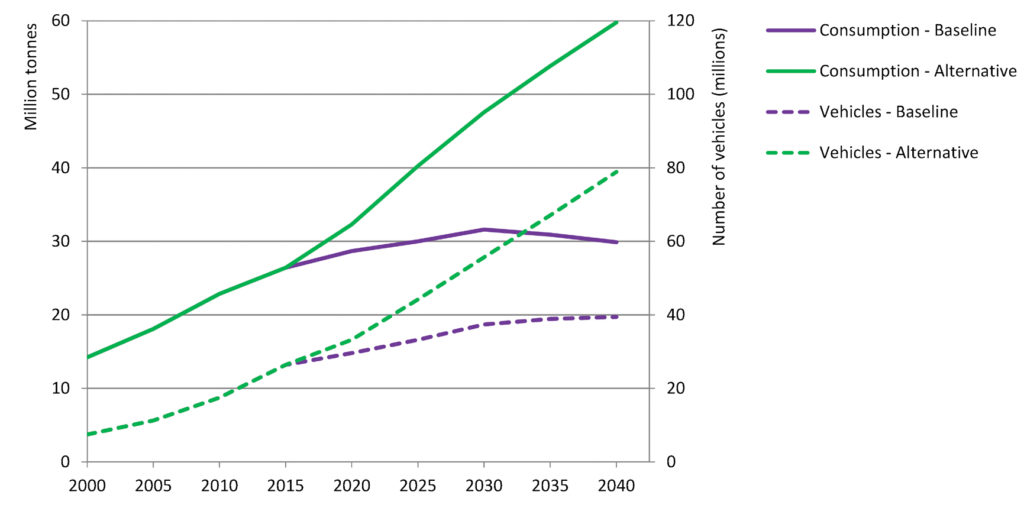
Ultimately, achieving a truly sustainable, low-carbon road-transport system will require a wholesale move away from fossil- based fuels in the long term. The Baseline Scenario paints one picture of how Autogas demand could evolve to 2040 in a business-as- usual world: other outcomes in which Autogas plays a much more important role are possible. The Alternative Scenario assumes that the number of Autogas vehicles and their share of Autogas in the overall vehicle fleet reach twice the levels of those in the Baseline Scenario in each region by 2040, while taking account of country-specific differences. This requires a strengthening of incentive policies, including lower taxes on Autogas relative to other fuels and/or bigger financial incentives for converting existing vehicles (OEM or aftermarket) to run on the fuel, as well as support from the Autogas industry, vehicle manufacturers and fuel-system equipment producers and installers. In some countries, it might be necessary to raise public awareness about the benefits of Autogas, especially where it is not yet established. Global Autogas consumption continues to grow steadily in the Alternative Scenario, reaching 60 Mt by 2040 – well over twice the current level. The Autogas vehicle fleet grows even faster as fuel economy continues to improve throughout the projection period, reaching almost 80 million in 2040 – nearly three times the current size (Figure 10 and Table 4). Worldwide, Autogas vehicles make up 3.4% of the total fleet in 2040, compared with 1.7% in the Baseline Scenario and around 2% today.
Figure 10: World Autogas consumption and vehicles by scenario
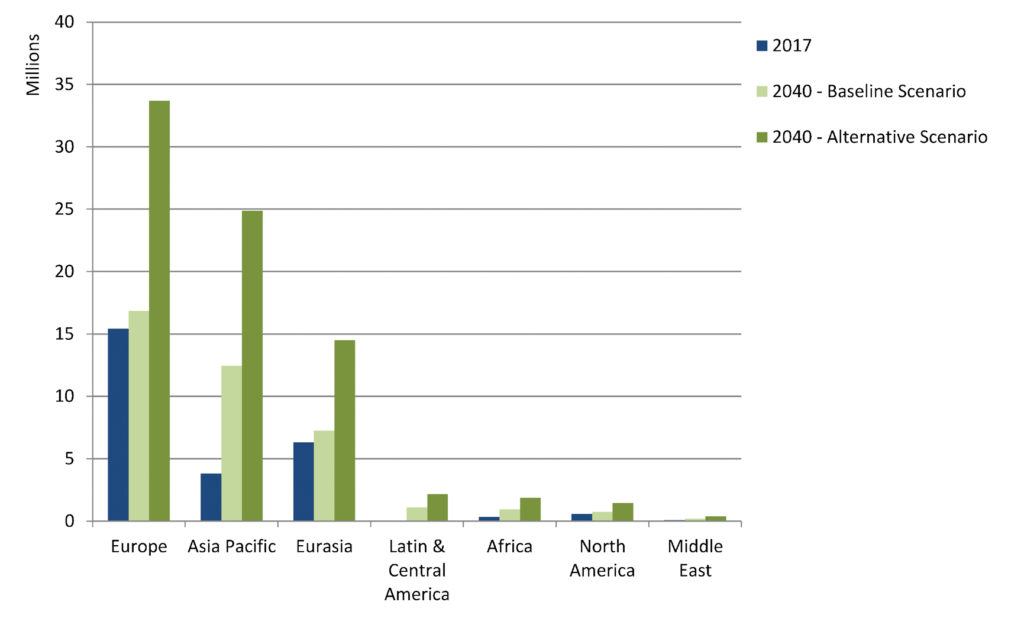
Europe, Eurasia and Asia-Pacific continue to account for the bulk of the global Autogas fleet throughput the projection period in the Alternative Scenario, contributing almost all of the increase in vehicle numbers. Their combined share of the global Autogas fleet nonetheless falls slightly, from 94% in 2017 to 93% in 2040 (Figure 11).
The fleet in Asia grows the most in absolute terms, quadrupling to 25 million, yet still accounts for just 2.3% of the region’s total vehicle fleet – up from 1.6% now. In Europe, the fleet more than doubles to 34 million – the largest of any region – while its share of the total vehicle fleet rises from 4.4% at present to 8.6% in 2040.
Table 4: Autogas consumption and vehicles in the Alternative Scenario by region
| wdt_ID | 2000 | 2010 | 2017 | 2020 | 2030 | 2040 | |
|---|---|---|---|---|---|---|---|
| 1 | Consumption (Mt) | ||||||
| 2 | North America | 196,00 | 156,00 | 204,00 | 259,00 | 329,00 | 378,00 |
| 3 | Europe | 440,00 | 778,00 | 1.086,00 | 1.234,00 | 1.688,00 | 1.961,00 |
| 4 | Eurasia | 65,00 | 237,00 | 446,00 | 590,00 | 978,00 | 1.298,00 |
| 5 | Latin & Central America | 8,00 | 74,00 | 101,00 | 104,00 | 180,00 | 274,00 |
| 6 | Asia Pacific | 668,00 | 973,00 | 770,00 | 934,00 | 1.396,00 | 1.773,00 |
| 7 | Africa | 21,00 | 39,00 | 70,00 | 99,00 | 163,00 | 260,00 |
| 8 | Middle East | 25,00 | 30,00 | 7,00 | 10,00 | 21,00 | 35,00 |
| 9 | World | 1.422,00 | 2.285,00 | 2.683,00 | 3.230,00 | 4.755,00 | 5.978,00 |
| 10 | Vehicle numbers (millions) |
Figure 11: Autogas vehicle fleet by region and scenario
This scenario is broadly consistent with other sustainable transport scenarios. For example, the share of non-renewable gaseous fuels in total transport energy use in the REMap Case of the Global Energy Transformation Roadmap of the International Renewable Energy Agency (IRENA) doubles to 4% over 2015-2050 (IRENA, 2018).
The share of renewables (essentially biofuels, including bioLPG) rises from 4% to 58% over that period and that of electricity to 33% (28% renewables-based). This reflects the constraints on moving to a totally carbon-free transport system within little more than 30 years and the need to rely more on the least carbon-intensive non-renewable transport fuels such as fossil-based Autogas.
“Making this Alternative Scenario a reality – doubling the number of Autogas vehicles and their share in the global vehicle fleet – would require relatively modest adjustments to the structure of fuel taxation or vehicle grants in most countries.”
The projected increase in global Autogas demand in the Alternative Scenario is modest relative to overall LPG supply, which is set to continue to expand in the coming decades. In the IEA’s New Policies Scenario, on which these projections are based, total production of natural gas liquids – the primary source of LPG – increases by more than 28% between 2016 and 2040 (IEA, 2017b). Were total LPG demand to grow faster as a result of higher Autogas use, refiners could increase LPG yields at the margin and upstream companies could pursue more liquid-rich fields, tempering any significant upward pressure on international prices. Re-directing flared gas to support the faster growth in demand for Autogas in the Alternative Scenario would also be an option.
In addition, there is considerable scope for replacing LPG as a petrochemical feedstock with naphtha, ethane or distillate, freeing up more LPG for use as Autogas. The increase in global Autogas demand in the Alternative Scenario vis-à-vis the Baseline Scenario in 2040 amounts to 30 Mt – equal to only 8% of total supply in the latter scenario and around one-third of the projected increase in total LPG supply over 2016-2040. In addition, a significant part of the increase in Autogas demand could be met with bioLPG, depending on technological advances and investment.
Making this Alternative Scenario a reality would require relatively modest adjustments to the structure of fuel taxation or vehicle grants in most countries. An econometric analysis was carried out based on the results of the study of inter-fuel competition in the countries surveyed in the 2018 edition of Autogas Incentive Policies (WLPGA/Liquid Gas Europe, 2018). The results of that analysis show that the average payback period for switching from gasoline to Autogas would need to fall on average from 26 to 18 months to achieve a doubling of the share of Autogas in total automotive fuel use. This could be achieved either by an increase in the tax on gasoline relative to Autogas or by the introduction of a grant or tax credit to cover part or all of the conversion cost.
The need for these measures would be alleviated or, in some cases, removed entirely by additional measures to discourage the use of diesel on environmental grounds beyond those already taken into account in the Baseline Scenario. Diesel, which competes most with Autogas in high-mileage vehicles, is often – perversely – taxed less in energy terms than Autogas at present. Other non- financial measures, such as exemptions for Autogas vehicles from driving restrictions in city centres for environmental reasons, could also help boost the attractiveness of Autogas, further reducing the need to lower the tax on Autogas or offer financial incentives for converting vehicles to Autogas.