A Global Roadmap for Autogas
Business as usual: the Baseline Scenario
The last few years have seen significant changes in policy in several countries leading to shifting fortunes – positive and negative – for Autogas, depending on the country. Further changes are to be expected in the future in the face of growing concerns about the environmental impact of rising demand for mobility. To better understand how these changes might impact the prospects for the global Autogas market and the potential for policy to drive strong growth in demand, we have prepared a set of projections of Autogas use using a scenario approach (Box 6). Two scenarios were formulated: a Baseline Scenario, which incorporates the assumption of no change in current government policies with respect to Autogas and other transport fuels and technologies; and an Alternative Scenario, in which the number of Autogas vehicles is assumed to reach twice that of the Baseline Scenario in each region in 2040. The aim is to show how Autogas use could evolve in a business-as-usual world and how much faster it could grow given concerted action on the part of all stakeholders to make Autogas a more attractive fuel option.
The Baseline Scenario was based on the transport market projections of the International Energy Agency’s World Energy Outlook 2017 for the New Policies Scenario, which takes account of current and planned polices and measures. The IEA does not publish detailed projections of use for transport by fuel or sub-sector, but kindly agreed to provide aggregate projections of oil use in road transport by major region to 2040.1 These projections were used to derive projections of Autogas use by region by applying assumptions about market share in a bottom-up manner based on information about policy developments, insights from WLPGA members and, where available, official national projections of road-transport fuel use. Projections of the Autogas vehicle fleet were then obtained by applying assumptions about the evolution of vehicle fuel efficiency, based on the long-term projections of the total vehicle fleet (also provided by the IEA).
For the Alternative Scenario, a back-casting approach was used, based on the assumption that the number of Autogas vehicles is twice that of the Baseline Scenario in each region in 2040 – the target set out in this roadmap.
The resulting projections were used to calculate total Autogas consumption by country and region using the same projections of vehicle fuel efficiency as in the Baseline Scenario. In order to verify the plausibility of the underlying assumption in the Alternative Scenario, detailed econometric analysis using time series and cross- country data of the implications of increased Autogas use for policy incentives was carried out, based on the results of the competitiveness analysis carried out for the Autogas Incentive Policies report (WLPGA/Liquid Gas Europe, 2018). In most cases, this analysis confirmed that the policy changes in the form of fuel-tax reform or financial incentives for Autogas vehicles were plausible. Nonetheless, for some countries, the assumption was adjusted, while ensuring that it was respected at the regional level.
For both scenarios, the impact of changes in the share of Autogas in the total LPG market were calculated based on the global LPG supply projections of the IEA. The results confirm that the projected growth in global LPG demand in both cases is modest and would be unlikely to put significant upward pressure on international prices and, thereby, to hold back demand in national markets (see main text).
In the Baseline Scenario, global Autogas consumption continues to grow, reaching a peak of a little over 31 Mt in 2030 – about 18% higher than in 2017. Thereafter, it goes into gradual decline, dipping to just under 30 Mt in 2040 (Figure 8). Up to 2030, sales of EVs are not large enough to significantly affect sales of gasoline cars, which are boosted by both rising demand for mobility and a continuing slump in demand for diesel vehicles; the expansion of the gasoline vehicle fleet over this period increases the scope for switching to Autogas. Demand in all regions, including Europe, continues to rise over this period.
The reversal in the upward trend after 2030 is driven largely by a decline in the share of Autogas as end users opt increasingly for gasoline hybrids and EVs. Falling gasoline use in Europe – the main Autogas-consuming region – contributes to the overall decline in global demand for Autogas; gasoline demand in the rest of the world is either flat or continues to grow after 2030 – notably in the Asia-Pacific region. Total oil consumption for road transport worldwide grows only very slowly over 2017-2040, as rising energy needs in that sector are almost entirely offset by the steady decline in the share of thermal fuels with the increased penetration of EVs and, to a lesser extent, biofuels.2
Figure 8: Autogas consumption in the Baseline Scenario by region
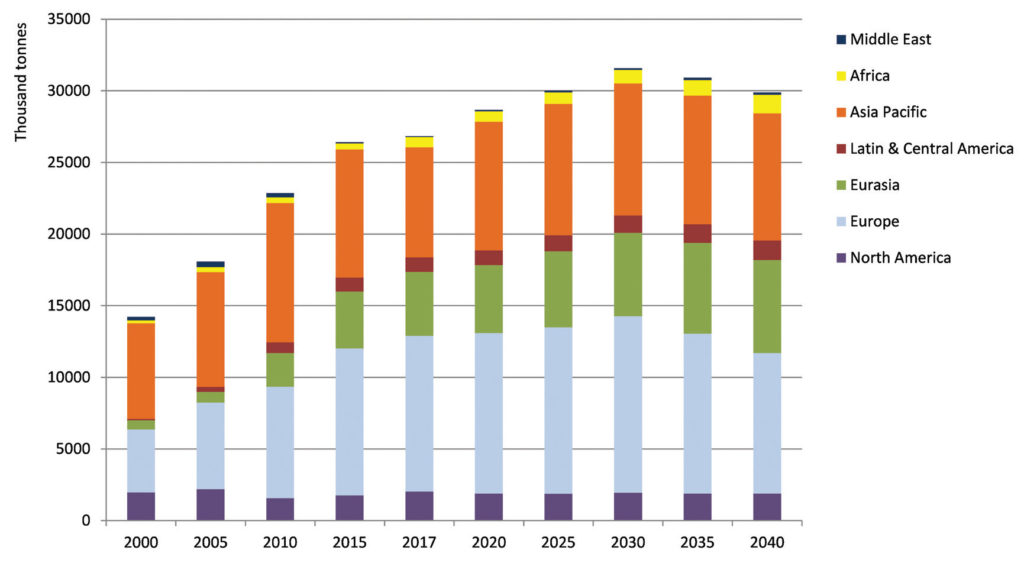
“On current trends, global Autogas consumption is projected to continue to grow, reaching a peak of just over 31 Mt in 2030 – about 18% higher than in 2017 – before going into gradual decline, as end users opt increasingly for gasoline hybrids and EVs.”
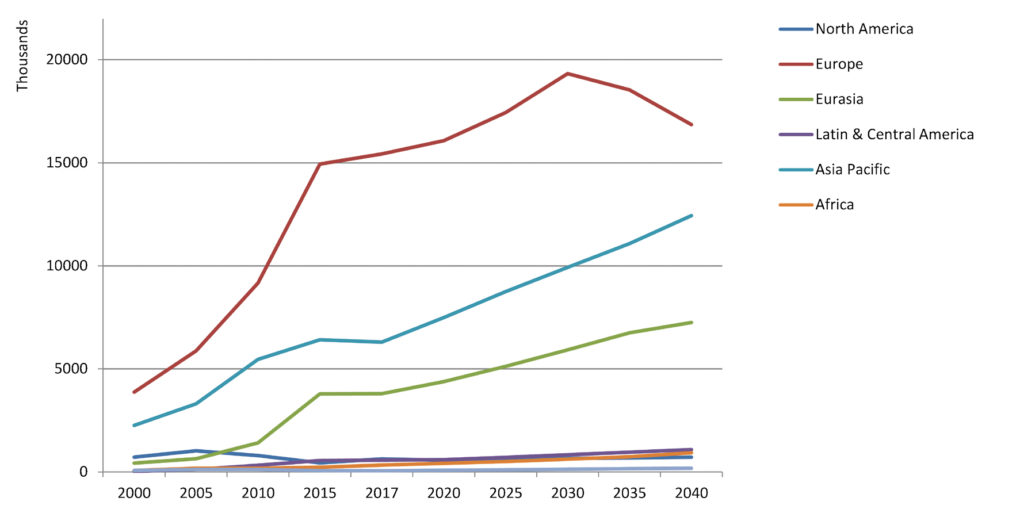
The rise in Autogas consumption to 2030 is driven by a steady expansion of the vehicle fleet, notably in Europe, where the market is already well-established. Globally, the Autogas fleet reaches a plateau of around 39 million by the end of the 2030s – 45% up on 2017 (Table 3). Fuel economy continues to improve worldwide over the entire projection period, which is why Autogas use goes into decline despite rising vehicle numbers. The fleet continues to expand in all regions throughout the projection period except in Europe, where it goes into long-term decline after 2030 (Figure 9).
By 2040, 93% of all the Autogas vehicles in the world are in just three regions: Europe, Asia- Pacific and Eurasia. The share of Autogas in the global vehicle fleet remains broadly constant at 2% to 2030 and then declines gradually to 1.7% by 2040.
Table 3: Autogas consumption and vehicles in the Baseline Scenario by region
Figure 9: Autogas vehicles in the Baseline Scenario by region
(2) In the IEA’s New Policies Scenario, on which the Baseline Scenario is based, the number of EVs on the world’s roads climbs from just over 3 million in 2017 to almost 280 million by 2040 – equal to around 15% of the total car fleet and displacing around 2.5 mb/d (110 Mt) of oil demand. Over the same period, the use of biofuels almost triples to 4.1 mb/d (IEA, 2017b).