A Global Roadmap for Autogas
Clearing the air
Doubling the number of Autogas vehicles on the road in 2040 compared with business- as-usual trends – the vision set out in this roadmap – would yield significant improvements in local air quality. To evaluate the scale of those benefits, the WLPGA in partnership with Liquid Gas Europe (LGE) commissioned a study by the Belgium-based research group, Transport & Mobility Leuven (TML), to estimate the emissions reductions and social welfare benefits that would be achieved in the Alternative Scenario relative to the Baseline Scenario for LDVs in Europe. We then extended this analysis to the rest of the world and to the overall vehicle fleet using the same set of emission factors (Box 7).
In an effort to better understand and quantify the potential benefits that would stem from a greater penetration of Autogas, the WLPGA and LGE commissioned a study by the research group, Transport & Mobility Leuven (TML), based in Belgium. Having already carried out numerous studies on transport and energy on behalf of the European Commission, TML is particularly well-placed to analyse the potential impact of the emergence of Autogas as a more significant player in Europe’s road transport fuel mix. In the framework of its collaboration with the European Commission, TML developed TREMOVE, an econometric modelling tool used to predict emissions from the European passenger-car sector on the basis of policy scenarios. To evaluate the potential impact of an increased role for Autogas, TML developed a specific model using relevant modules of TREMOVE covering the total vehicle stock, road-transport fuel consumption and the resulting emissions, as well as the implications for social welfare in terms of reduced external impacts resulting from climate change.
Two of the scenarios prepared by TML were calibrated to the Baseline and Alternative Scenarios used in this report.
For the rest of the world, we adopted the same set of emission factors deployed by TML, which we applied to our projections of Autogas and other transport fuels based on the long- term projections of the IEA’s World Energy Outlook (see Box 6, above). For all regions, we calculated the difference in emissions and the social welfare implications between the two scenarios, applying region-specific estimates of the social welfare benefits of lower CO2 emissions and the reduced external impacts of pollutant emissions on public health. In addition, we extended the analysis for all regions, including Europe, to HDVs.
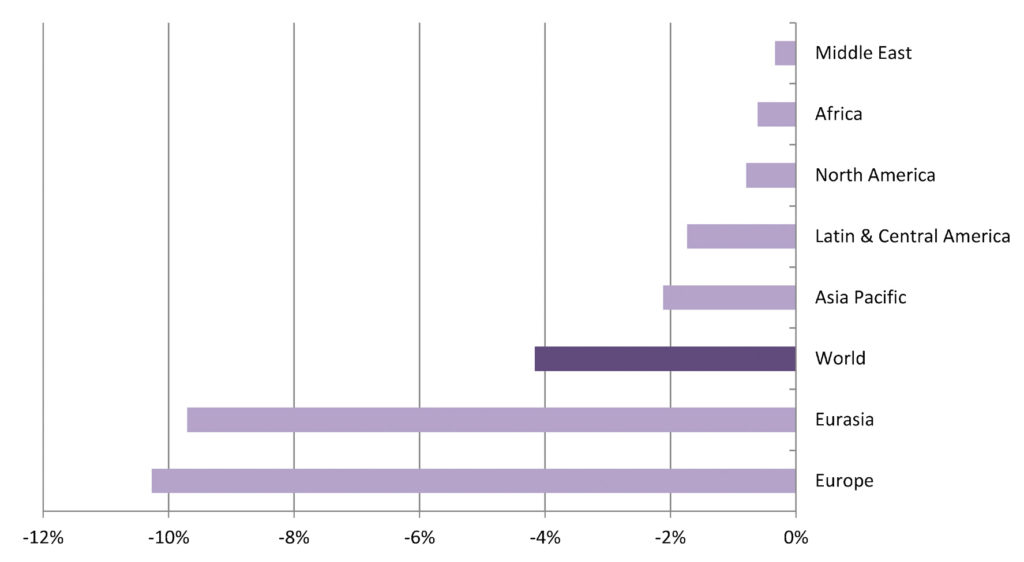
Achieving the Autogas vision would have the biggest impact on PM2.5 emissions from LDVs worldwide, which fall by 4.7% by 2040 in the Alternative Scenario compared with the Baseline Scenario. The large reduction in emissions relative to the size of the shift in the fuel mix of the LDV fleet reflects the much higher per kilometre emissions from diesel vehicles compared with both Autogas and, to a lesser extent, gasoline. The increase in the Autogas fleet in the Alternative Scenario is assumed to be offset by a corresponding fall in the numbers of gasoline and diesel cars, according to their shares of the total fleet in 2040 in the Baseline Scenario. This yields a big net reduction in emissions, especially in regions where diesels represent a large share of the overall LDV fleet. Thus, the biggest reductions in percentage terms occur in Eurasia and Europe, where the penetration of Autogas and diesel are highest and, therefore, where the shift from diesel to Autogas is biggest (Figure 12). For all types of vehicle, including buses and trucks, global PM2.5 emissions are reduced by close to 1%.
Figure 12: Reduction in global emissions of PM2.5 from LDVs in 2040 in the Alternative Scenario by region
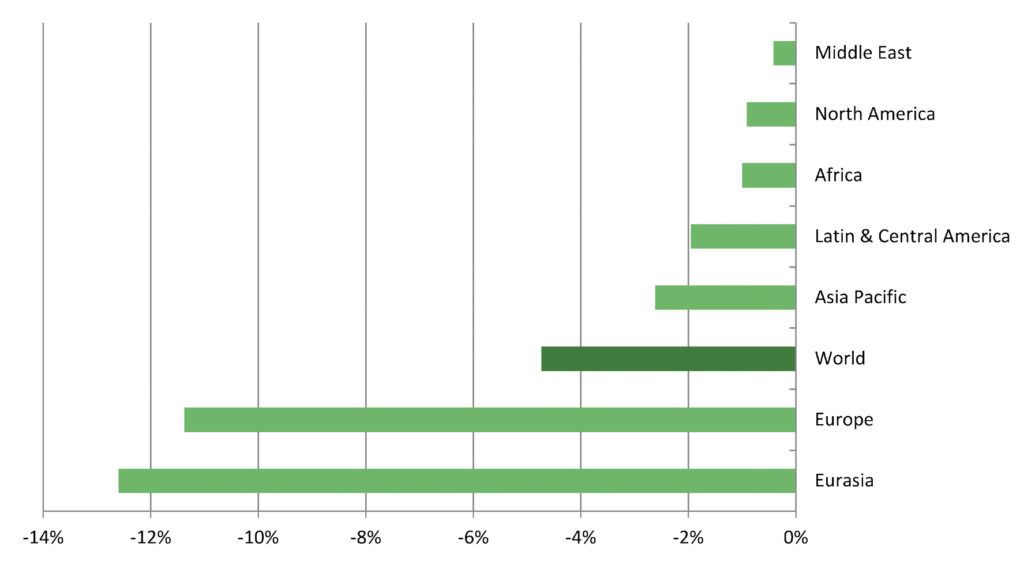
“Realising the Autogas opportunity in the Alternative Scenario would lower global emissions of NOx from LDVs by over 4% and those of PM by close to 5%, yielding social welfare gains, including savings on health costs and improved productivity, valued at almost $40 billion.”
While the switch to Autogas from gasoline and diesel for LDVs in the Alternative Scenario yields significant reductions in emissions of PM2.5 and NOx, those of CO and VOC increase marginally. For the world as a whole, emissions of CO rise by 0.7% for LDVs and 0.4% for all vehicle types, while those of VOC increase by 0.6% and 0.3% respectively. The overall environmental impact of these increases would, nonetheless, be substantially less than the effect of the large reductions in PM2.5 and NOx emissions, resulting in an important net environmental improvement.
Figure 13: Reduction in global emissions of NOx from LDVs in 2040 in the Alternative Scenario by region